NAMD 2.10 Benchmarks
To find the most appropriate number of nodes for a specific type of job, it
is essential to run one's own benchmarks. The sections below contain benchmark results for some
standard benchmarks.
May 2015
STMV benchmark, 1,066,628 atoms, periodic, PME (available from here)
Benchmarks performed on 16 x 2.6 GHz (Intel E5-2650v2), 56 Gb/s FDR Infiniband.
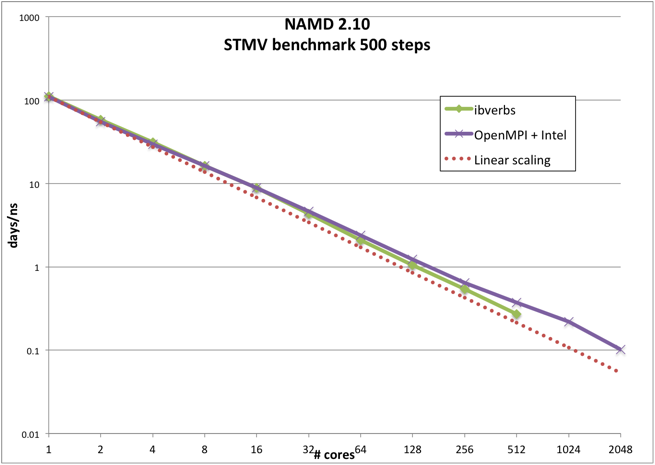
| # cores | Compiled with OpenMPI 1.8.4
Intel 2015.1.133 compiler | NAMD_2.10_Linux-x86_64-ibverbs
| days/ns | Efficiency | days/ns | Efficiency
| 1 | 109.344 | 100 | 111.308 | 100
| | 2 | 55.0939 | 99 | 58.3188 | 95
| | 4 | 29.6921 | 92 | 31.1797 | 89
| | 8 | 16.3232 | 84 | 16.2814 | 85
| | 16 | 8.8155 | 78 | 8.85272 | 78
| | 32 | 4.65757 | 73 | 4.30852 | 80
| | 64 | 2.39583 | 71 | 2.10381 | 82
| | 128 | 1.23227 | 69 | 1.04778 | 83
| | 256 | 0.644897 | 66 | 0.540371 | 80
| | 512 | 0.375016 | 57 | 0.27197 | 80
| | 1024 | 0.220472 | 48
| | 2048 | 0.101662 | 53
| | |
ApoA1 benchmark, 92,224 atoms, 12A cutoff + PME every 4 steps, periodic (available from here)
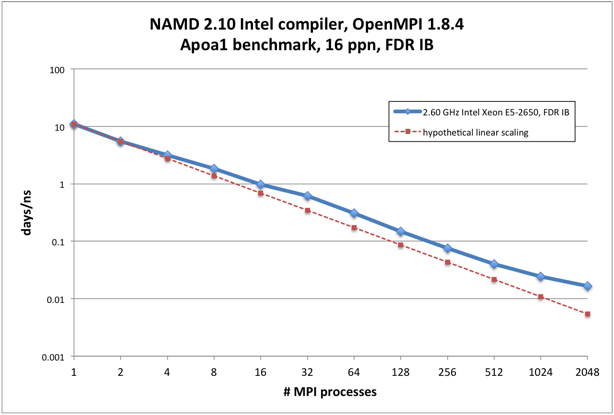
All runs performed on 16 x 2.6 GHz (Intel E5-2650v2), 56 Gb/s FDR Infiniband
| # cores | days/ns | Efficiency
| 1 | 11.0285 | 100
| | 2 | 5.51269 | 100
| | 4 | 3.11655 | 88
| | 8 | 1.84353 | 75
| | 16 | 0.967223 | 71
| | 32 | 0.610894 | 56
| | 64 | 0.305278 | 56
| | 128 | 0.148188 | 58
| | 256 | 0.0760402 | 57
| | 512 | 0.0398997 | 54
| | 1024 | 0.0244494 | 44
| | 2048 | 0.0165738 | 32
| |
Nvidia K20x GPU benchmarks
STMV benchmark, 1,066,628 atoms, periodic, PME (available from here)
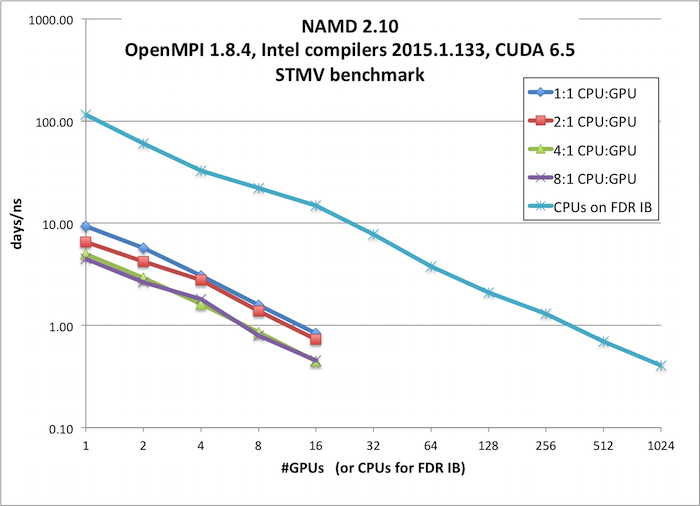
GPU runs were performed on: 16 x 2.6 GHz (Intel E5-2650v2) CPUs, 2 x NVIDIA K20x GPUS, 56 Gb/s FDR Infiniband
IBFDR runs were performed on: 16 x 2.6 GHz (Intel E5-2650v2), 56 Gb/s FDR Infiniband
Single-node performance on CPU+GPU is better than on a standard node. However, for small molecular systems (e.g. ApoA1, 92K atoms), the absolute
performance in days/ns is better on multi-node IB jobs than on GPU nodes. For large molecular systems (e.g. STMV, 1M atoms),
multinode jobs on the GPU nodes have better price/performance than on IB nodes, so that it is worthwhile to run simulations of such large systems on the GPU nodes.
Thus, the performance of an individual job depends on the size of the system and may depend on other simulation factors. It is therefore vital to run your own
benchmarks to determine whether there is an advantage to using the GPU nodes.
| # GPUs | GPU + CPU
(days/ns) | CPUs on IBFDR
(days/ns)
|
| 1.1 CPU:GPU | 2:1 CPU:GPU | 4:1 CPU:GPU | 8:1 CPU:GPU
|
| 1 | 9.35 | 6.56 | 5.02 | 4.47 | 115.56
|
| 2 | 5.75 | 4.24 | 2.93 | 2.66 | 60.54
|
| 4 | 3.07 | 2.78 | 1.62 | 1.80 | 32.75
|
| 8 | 1.58 | 1.38 | 0.85 | 0.80 | 21.96
|
| 16 | 0.84 | 0.73 | 0.45 | 0.45 | 14.85
|
| 32 | | 7.81
|
| 64 | 3.78
|
| 128 | 2.10
|
| 256 | 1.31
|
| 512 | 0.69
|
| 1024 | 0.40
|
ApoA1 benchmark, 92,224 atoms, 12A cutoff + PME every 4 steps, periodic (available from here)
GPU runs were performed on: 16 x 2.6 GHz (Intel E5-2650v2) CPUs, 2 x NVIDIA K20x GPUS, 56 Gb/s FDR Infiniband
IBFDR runs were performed on: 16 x 2.6 GHz (Intel E5-2650v2), 56 Gb/s FDR Infiniband
| # GPUs | GPU + CPU
(days/ns) | CPUs on IBFDR
(days/ns)
|
| 1.1 CPU:GPU | 2:1 CPU:GPU | 4:1 CPU:GPU | 8:1 CPU:GPU
|
| 1 | 0.87 | 0.60 | 0.48 | 0.51 | 11.03
|
| 2 | 0.53 | 0.34 | 0.29 | 0.30 | 5.51
|
| 4 | 0.30 | 0.20 | 0.19 | 0.19 | 3.12
|
| 8 | 0.16 | 0.14 | 0.14 | 0.14 | 1.84
|
| 16 | 0.10 | 0.11 | 0.11 | 0.11 | 0.97
|
| 32 | | 0.61
|
| 64 | 0.31
|
| 128 | 0.15
|
| 256 | 0.08
|
| 512 | 0.04
|
| 1024 | 0.02
|
Nvidia K80 GPU benchmarks (currently only available to NCI CCR users)
STMV benchmark, 1,066,628 atoms, periodic, PME (available from here)
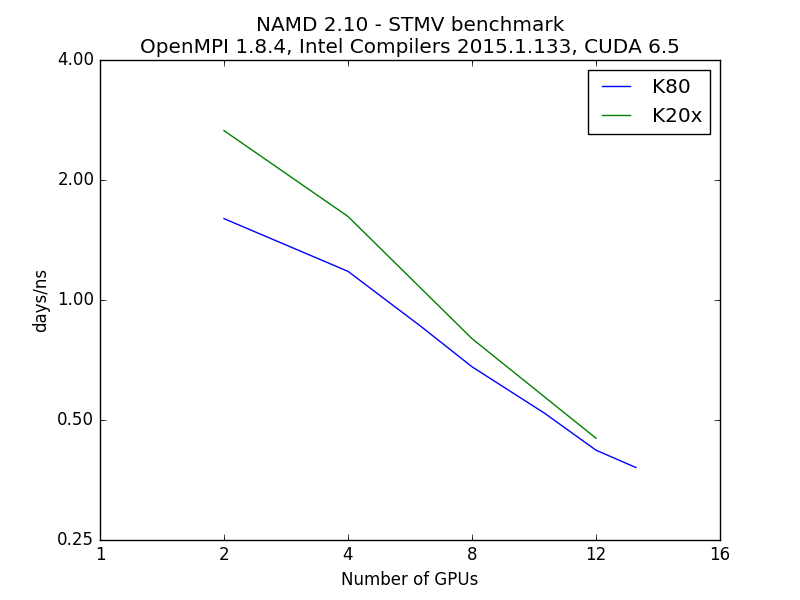
GPU runs were performed on: 28 x 2.3 GHz (Intel E5-2695v3) CPUs, 2 x NVIDIA K80 GPU cards (each having 2 GPUs), 56 Gb/s FDR Infiniband
The data shows that using nodes with Nvidia K80 GPUs provides a substantial speedup over nodes with K20x GPUs. Note that each K80 card has
two GPUs on it. It takes 8 K20x cards to match the performance of 2 K80 cards. However, each K80 card contains 2 GPUs, so in this benchmark,
each of those GPUs provided about the same performance as a K20x (results for the K20x are from the prior set of benchmarks described
above). However, the STMV benchmark is a very large system, and it is probable that smaller systems with less computation
will not fare as well.
As when using the K20x GPU nodes, it is vital to run your own benchmarks to determine whether there is an advantage to using the GPU nodes and
K80s in particular. Note that there is no real advantage to using more than 2 nodes with K80s, as parallel efficiency drops dramatically after
that point.
| # K80 card used (#GPUs/2) | Performance (days/ns) | K20x Performance (days/ns) |
| 2* | 1.600 | 2.66 |
| 4 | 1.170 | 1.62 |
| 6 | 0.868 | |
| 8 | 0.674 | 0.80 |
| 10 | 0.518 | |
| 16 | 0.420 | 0.45 |
| 20 | 0.370 | |
* - Used 16 CPUs and all 4