Pysamstats is a fast Python and command-line utility for extracting simple statistics against genome positions based on sequence alignments from a SAM or BAM file.
Allocate an interactive session and run the program. Sample session:
[user@biowulf]$ sinteractive --mem=4g
[user@@cn3200 ~]$ module load pysamstats
[+] Loading java 1.8.0_11  ...
[+] Loading samtools 1.9  ...
[+] Loading pysamstats  0.24.3
[user@biowulf]$ pysamstats --help
age: pysamstats [options] FILE

Calculate statistics against genome positions based on sequence alignments
from a SAM or BAM file and print them to stdout.

Options:
  -h, --help            show this help message and exit
  -t TYPE, --type=TYPE  Type of statistics to print, one of: alignment_binned,
                        baseq, baseq_ext, baseq_ext_strand, baseq_strand,
                        coverage, coverage_binned, coverage_ext,
                        coverage_ext_binned, coverage_ext_strand, coverage_gc,
                        coverage_strand, mapq, mapq_binned, mapq_strand, tlen,
                        tlen_binned, tlen_strand, variation, variation_strand.
  -c CHROMOSOME, --chromosome=CHROMOSOME
                        Chromosome name.
  -s START, --start=START
                        Start position (1-based).
  -e END, --end=END     End position (1-based).
  -z, --zero-based      Use zero-based coordinates (default is false, i.e.,
                        use one-based coords).
  -u, --truncate        Truncate pileup-based stats so no records are emitted
                        outside the specified position range.
  -d, --pad             Pad pileup-based stats so a record is emitted for
                        every position (default is only covered positions).
  -D MAX_DEPTH, --max-depth=MAX_DEPTH
                        Maximum read depth permitted in pileup-based
                        statistics. The default limit is 8000.
  -f FASTA, --fasta=FASTA
                        Reference sequence file, only required for some
                        statistics.
  -o, --omit-header     Omit header row from output.
  -p N, --progress=N    Report progress every N rows.
  --window-size=N       Size of window for binned statistics (default is 300).
  --window-offset=N     Window offset to use for deciding which genome
                        position to report binned statistics against. The
                        default is 150, i.e., the middle of 300bp window.
  --format=FORMAT       Output format, one of {tsv, csv, hdf5} (defaults to
                        tsv). N.B., hdf5 requires PyTables to be installed.
  --output=OUTPUT       Path to output file. If not provided, write to stdout.
  --fields=FIELDS       Comma-separated list of fields to output (defaults to
                        all fields).
  --hdf5-group=HDF5_GROUP
                        Name of HDF5 group to write to (defaults to the root
                        group).
  --hdf5-dataset=HDF5_DATASET
                        Name of HDF5 dataset to create (defaults to "data").
  --hdf5-complib=HDF5_COMPLIB
                        HDF5 compression library (defaults to zlib).
  --hdf5-complevel=HDF5_COMPLEVEL
                        HDF5 compression level (defaults to 5).
  --hdf5-chunksize=HDF5_CHUNKSIZE
                        Size of chunks in number of bytes (defaults to 2**20).

Pileup-based statistics types (each row has statistics over reads in a pileup column):

    * coverage            - Number of reads aligned to each genome position
                            (total and properly paired).
    * coverage_strand     - As coverage but with forward/reverse strand counts.
    * coverage_ext        - Various additional coverage metrics, including
                            coverage for reads not properly paired (mate
                            unmapped, mate on other chromosome, ...).
    * coverage_ext_strand - As coverage_ext but with forward/reverse strand counts.
    * coverage_gc         - As coverage but also includes a column for %GC.
    * variation           - Numbers of matches, mismatches, deletions,
                            insertions, etc.
    * variation_strand    - As variation but with forward/reverse strand counts.
    * tlen                - Insert size statistics.
    * tlen_strand         - As tlen but with statistics by forward/reverse strand.
    * mapq                - Mapping quality statistics.
    * mapq_strand         - As mapq but with statistics by forward/reverse strand.
    * baseq               - Base quality statistics.
    * baseq_strand        - As baseq but with statistics by forward/reverse strand.
    * baseq_ext           - Extended base quality statistics, including qualities
                            of bases matching and mismatching reference.
    * baseq_ext_strand    - As baseq_ext but with statistics by forward/reverse strand.

Binned statistics types (each row has statistics over reads aligned starting within a genome window):

    * coverage_binned     - As coverage but binned.
    * coverage_ext_binned - As coverage_ext but binned.
    * mapq_binned         - Similar to mapq but binned.
    * alignment_binned    - Aggregated counts from cigar strings.
    * tlen_binned         - As tlen but binned.

Examples:

    pysamstats --type coverage example.bam > example.coverage.txt
    pysamstats --type coverage --chromosome Pf3D7_v3_01 --start 100000 --end 200000 example.bam > example.coverage.txt

Version: 0.24.3 (pysam 0.8.4)
Copy pysamstats sample data to your currend directory:
[user@cn3200 ~]$ cp $PYSAMSTATS_DATA/* .Run pysamstats on the sample data:
[user@cn3200 ~]$ pysamstats -t coverage test.bam
chrom pos reads_all reads_pp
Pf3D7_01_v3 925 12 9
Pf3D7_01_v3 926 21 15
Pf3D7_01_v3 927 32 21
Pf3D7_01_v3 928 44 26
Pf3D7_01_v3 929 61 39
Pf3D7_01_v3 930 76 53
Pf3D7_01_v3 931 90 65
Pf3D7_01_v3 932 107 76
Pf3D7_01_v3 933 114 80
Pf3D7_01_v3 934 129 90
Pf3D7_01_v3 935 140 96
Pf3D7_01_v3 936 160 108
Pf3D7_01_v3 937 170 117
Pf3D7_01_v3 938 185 123
...
[user@cn3200 ~]$ pysamstats -t alignment_binned test.bam
chrom pos reads_all bases_all M I D N S H P=X
Pf3D7_01_v3 151 0 0 0 0 0 0 0 0 0 00
Pf3D7_01_v3 451 0 0 0 0 0 0 0 0 0 00
Pf3D7_01_v3 751 0 0 0 0 0 0 0 0 0 00
Pf3D7_01_v3 1051 1228 93328 92479 37 42 0 812 0 0 00
Pf3D7_01_v3 1351 497 37772 37700 1 4 0 71 0 0 00
Pf3D7_01_v3 1651 218 16568 16472 2 2 0 94 0 0 00
Pf3D7_01_v3 1951 118 8968 8944 2 2 0 22 0 0 00
...
[user@cn3200 ~]$ pysamstats -t baseq test.bam
chrom pos reads_all reads_pp rms_baseq rms_baseq_pp
Pf3D7_01_v3 925 12 9 32 32
Pf3D7_01_v3 926 21 15 28 27
Pf3D7_01_v3 927 32 21 30 30
Pf3D7_01_v3 928 44 26 29 28
Pf3D7_01_v3 929 61 39 32 32
...
[user@cn3200 ~]$ python
>>> import pysam
>>> import pysamstats
>>> import matplotlib.pyplot as plt
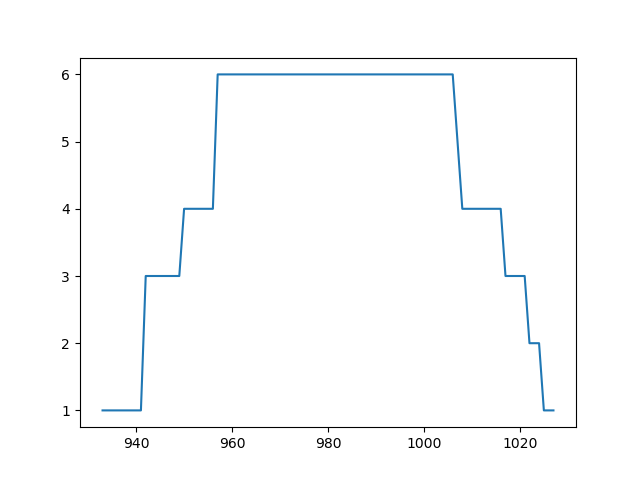
>>> mybam = pysam.AlignmentFile('rna.bam')
>>> a = pysamstats.load_coverage(mybam, chrom='Pf3D7_01_v3', start=100, end=2000)
>>> plt.plot(a.pos, a.reads_all)
>>> plt.show()
[user@cn3200 ~]$ exit
salloc.exe: Relinquishing job allocation 46116226
[user@biowulf ~]$
Create a batch input file (e.g. pysamstats.sh). For example:
#!/bin/bash
#SBATCH --mem=4g
module load pysamstats
pysamstats [options] file1.bam > output1
pysamstats [options] file2.bam > output2
...
Submit this job using the Slurm sbatch command.
sbatch pysamstats.sh
Create a swarmfile (e.g. pysamstats.swarm). For example:
#!/bin/bash
cd /scratch/$USER
pysamstats [options] file1.bam > output1
pysamstats [options] file2.bam > output2
...
Submit this job using the swarm command.
swarm -f pysamstats.swarm -g 4