CoolBox is an open-source, user-friendly toolkit for visual analysis of genomics data. It is highly compatible with the Python ecosystem and customizable with a well-designed user interface. It can bed used, for example, to produce high-quality genome track plots or fetch commonly used genomic data files with a Python script or command line, to explore genomic data interactively within Jupyter environment or web browser.
Allocate an interactive session and run the program. Sample session:
[user@biowulf]$ sinteractive
[user@cig 3335 ~]$ module load coolbox
[+] Loading singularity 3.10.5 on cn3335
[+] Loading coolbox/0.3.8
[user@cn3335 ~]$ mkdir /data/$USER/coolbox && cd /data/$USER/coolbox
[user@cn3335 ~]$ coolbox version
0.3.8
[user@cn3335 ~]$ coolbox --help
NAME
coolbox - CoolBox Command Line Interface
SYNOPSIS
coolbox COMMAND |
DESCRIPTION
You can use this cli to create coolbox browser instance,
visualize your data directly in shell.
example:
1. Draw tracks within a genome range, save figure to a pdf file:
$ coolbox add XAxis - add BigWig test.bw - goto "chr1:5000000-6000000" - plot test.pdf
2. Generate a notebook and run jupyter to open browser:
$ coolbox add XAxis - add BigWig test.bw - goto "chr1:5000000-6000000" - run_jupyter
3. Run a independent web application.
$ coolbox add XAxis - add BigWig test.bw - goto "chr1:5000000-6000000" - run_webapp
FLAGS
--genome=GENOME
Default: 'hg19'
--genome_range=GENOME_RANGE
Type: Optional[str]
Default: None
--genome_range2=GENOME_RANGE2
Type: Optional[str]
Default: None
COMMANDS
COMMAND is one of the following:
show_doc
Print the document of specified Element type. For example: coolbox show_doc Cool
version
print coolbox version
(END)
:q
[user@cn3335 ~]$ cp $CB_DATA/* .
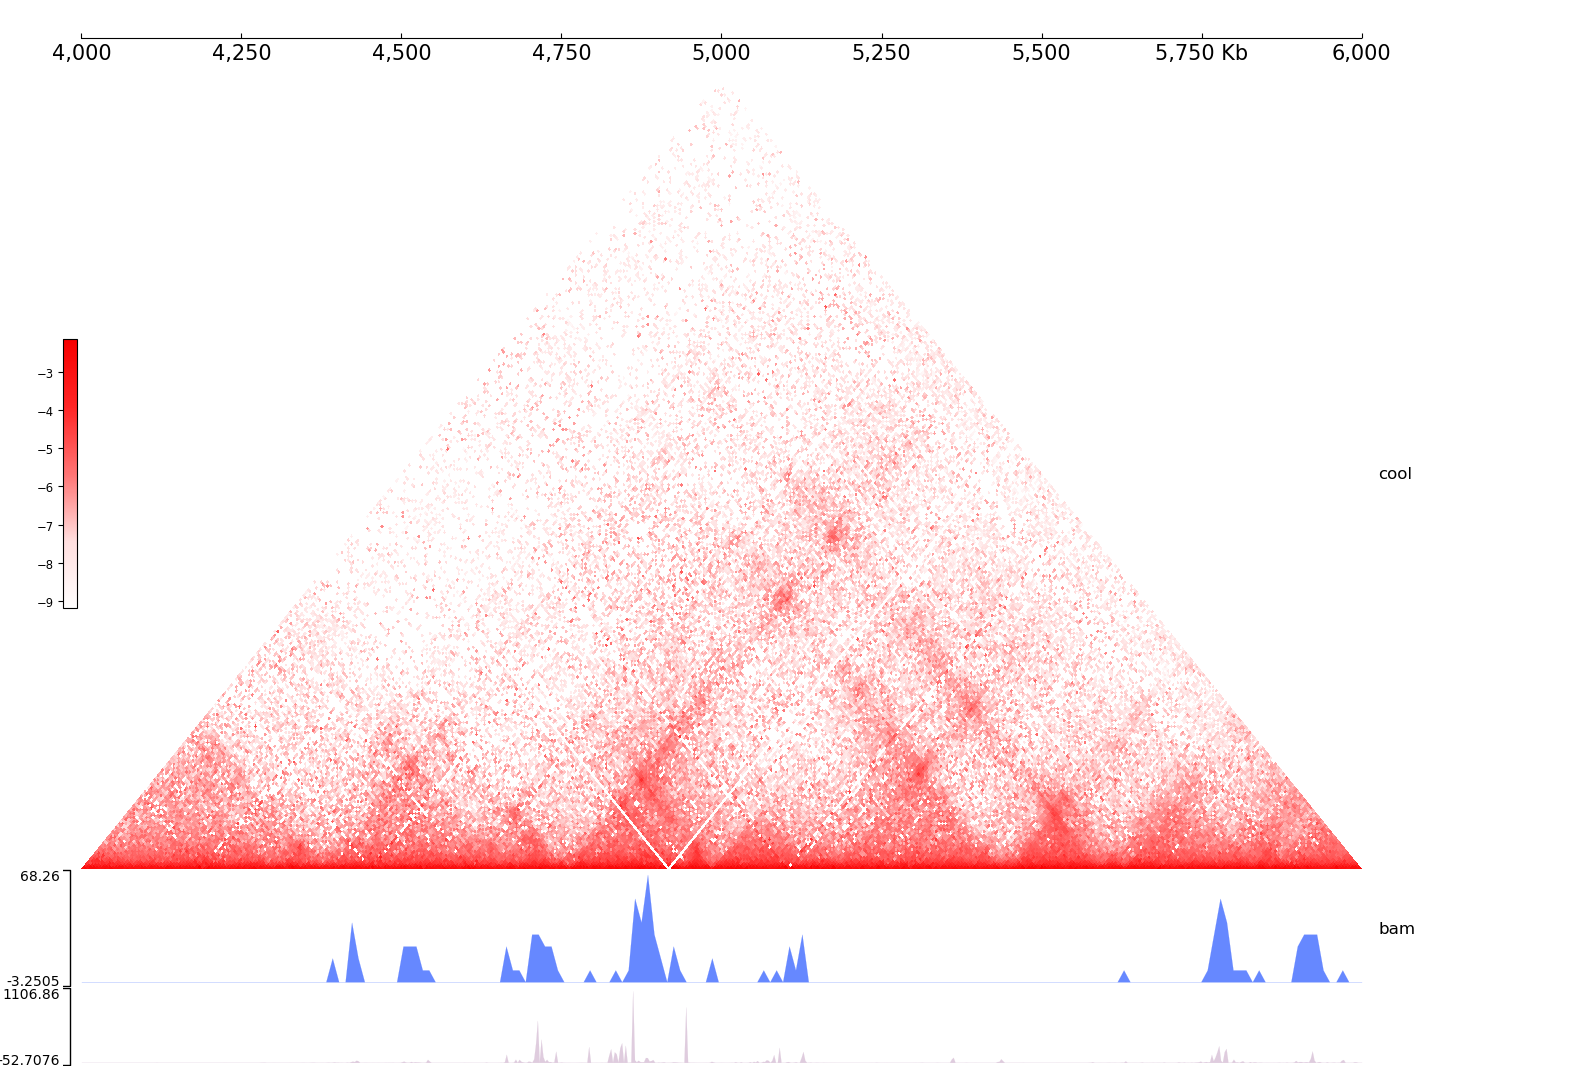
[user@cn3335 ~]$ coolbox add XAxis - \
add Cool ./cool_chr9_4000000_6000000.mcool - \
add Title "cool" - \
add BAMCov ./bam_chr9_4000000_6000000.bam - \
add Title "bam" - \
add BigWig ./bigwig_chr9_4000000_6000000.bw - \
add Title "bigwig" - \
goto "chr9:4000000-6000000" - \
plot ./test_coolbox.png
Before running the next command, Make sure you set up a graphical X11 connection.
[user@cn3335 ~]$ display ./test_coolbox.png
[user@cn3335 ~]$ exit
user@biowulf]$